Parametric Curves: Graph of Parametric Equations

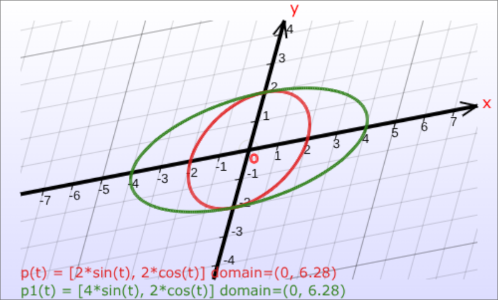
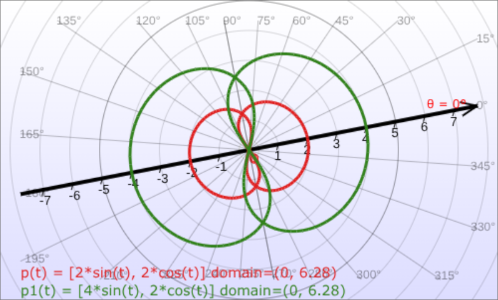
A 2D parametric curve is represented by a function p(t) = [f(t), g(t)]. In this context we call the variable t the parameter where it belongs to some domain D.

Cartesian & Polar Graphs of Parametric Equations

The graph of the parametric equations is simply the set of points (ordered pairs) (f(t), g(t)) for t in D.

These ordered pairs can be graphed in either xy-Cartesian coordinate system or rθ-polar coordinate system.

Our versatile parametric graphing calculator or our dedicated parametric curve grapher can be used to plot such graphs step-by-step, showing their construction in both Cartesian or polar coordinate systems.

Remark: The parametric expression you enter represents either the parametric equations x = f(t) y = g(t) or r = f(t) θ = g(t)

These notations for parametric equations are used based on whether you are graphing them in Cartesian or polar coordinate systems, respectively. It is also customary to represent a parametric expression correspondingly as either p(t) = [x(t),y(t)] or p(t) = [r(t),θ(t)]

Important Clarification on Graphing p(t)

It's crucial to understand that when graphing parametric equations represented by p(t), you are not graphing the function p(t) itself. The function p(t) defines a three-dimensional graph (curve), considering the independent variable t alongside its two output variables. Instead, you are graphing the range of p(t), which forms a two-dimensional curve—the projection of the three-dimensional curve onto the xy-plane or rθ-plane.

This is precisely why we say "the graph of the parametric equations represented by p(t)" or "the graph of the parametric expression defined by p(t)", and not simply "the graph of p(t)". The distinction highlights that we're visualizing the path traced by the outputs, rather than the input-output relationship including the parameter t.

The following figures, created by our parametric curve graphing calculator, show the graphs of some parametric curves drawn in the Cartesian and polar coordinate systems.

Graphs of parametric equations in the rectangular Cartesian coordinate system
Fig 1. Cartesian graphs of parametric curves in the rectangular coordinate system.
Graphs of parametric equations in the polar coordinate system
Fig 2. Polar graphs of parametric curves.

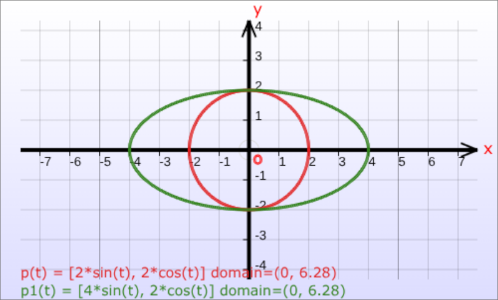
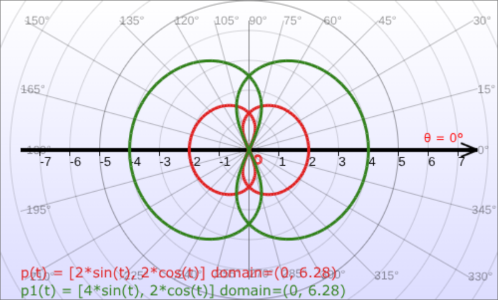
The graphs of the same parametric equations shown above are also drawn with axes rotated in each coordinate system.

Graphs of parametric equations in the oblique (non-perpendicular) Cartesian coordinate system.
Fig 3. Cartesian graphs of parametric curves in the oblique (non-perpendicular) coordinate system.
Graphs of parametric equations in the oblique polar coordinate system with the polar axis rotated.
Fig 4. Polar graphs of parametric curves in the oblique polar coordinate system.