Parametric Curves and Graphs
A 2D parametric curve is represented by a function p(t) = [f(t), g(t)]. In this context, we call the variable t the parameter, which belongs to a domain D.
You can use either our versatile parametric graphing calculator or our dedicated parametric equations grapher to plot parametric curves step-by-step, showing their construction in both Cartesian and polar coordinate systems.
Note: The parametric curve represents either the parametric equations x = f(t) y = g(t) or r = f(t) θ = g(t)
These notations for parametric equations are used based on whether you are graphing them in Cartesian or polar coordinate systems, respectively. It is customary to represent a parametric curve correspondingly as either p(t) = [x(t),y(t)] or p(t) = [r(t),θ(t)]
Cartesian & Polar Graphs of Parametric Equations
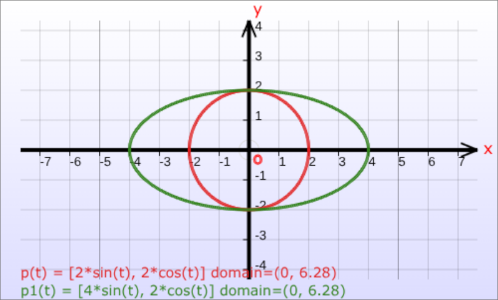
The graph of the parametric equations is simply the set of points (ordered pairs) (f(t), g(t)) for t in a domain D.
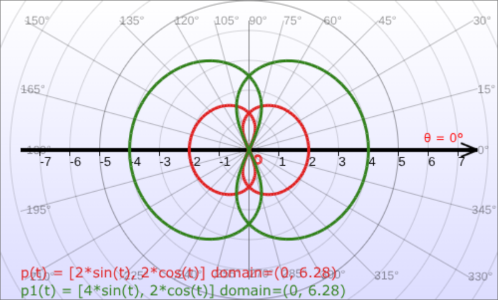
These ordered pairs can be graphed in either xy-Cartesian coordinate system or rθ-polar coordinate system.
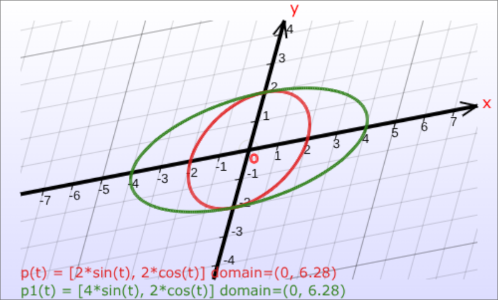
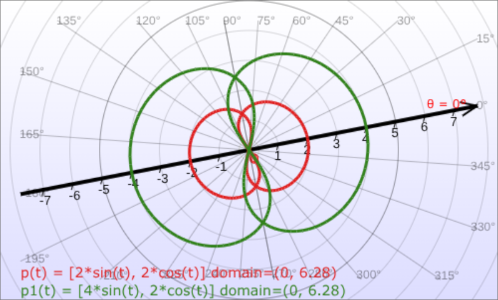
The following figures show the graphs of some parametric curves, generated by our Cartesian/polar graphing calculator.
The graphs of the same parametric equations shown above are also drawn with axes rotated in each coordinate system.